Skip to content
Technical analysis is a trading discipline that analyses investments based on price movements, historical trends, and market data. Unlike fundamental analysis, which examines economic and financial factors, technical analysis focuses on patterns and statistical indicators to forecast future price movements. This guide explores the key aspects of technical analysis and how traders can apply it effectively.

What is Technical Analysis?
Technical analysis in trading is the framework in which traders study price movement.
It is the study of past market data, primarily price and volume, to predict future price movements. It operates under the assumption that market prices reflect all relevant information and that price trends tend to repeat over time. Traders use this approach to identify potential buy and sell opportunities in various financial markets, including stocks, forex, commodities, and cryptocurrencies.
The idea behind technical analysis is that by examining past price movements, one is able to know current market conditions and predict potential price changes.
People who use this approach are called technical analysts, while traders relying on technical analysis are referred to as technical traders.
Key Principles of Technical Analysis
1. Market Prices Reflect Everything
Technical analysts believe that all known information about an asset, including economic, political, and company-specific data, is already priced into the market. Therefore, they focus solely on price movements and trading volume.
2. Price Moves in Trends
A fundamental principle of technical analysis is that price movements follow identifiable trends over time. These trends can be classified as:
Uptrend: A series of higher highs and higher lows.
Downtrend: A series of lower highs and lower lows.
Sideways Trend: Price moves within a range without a clear direction.
3. History Repeats Itself
Market behavior tends to repeat over time due to human psychology. Patterns and trends observed in the past are likely to reoccur, providing valuable insights for traders.
4. Fractals
Markets display fractal characteristics, where smaller patterns mirror larger ones, repeating across various scales and timeframes.
5. Adaptive Markets
Markets continuously evolve, and technical analysis adjusts to shifting conditions.
Also, the emotions and behaviors of market participants also shape recurring patterns and trends.
Key Components of Technical Analysis
1. Price Charts
Price charts help to show the price of a particular market over a specific period of time. You can change between different time frames (M5, M15, H1, H4, D1 etc) on any charting platform. Price charts are basic tools in technical analysis that help traders visualize market trends. Common chart types include:
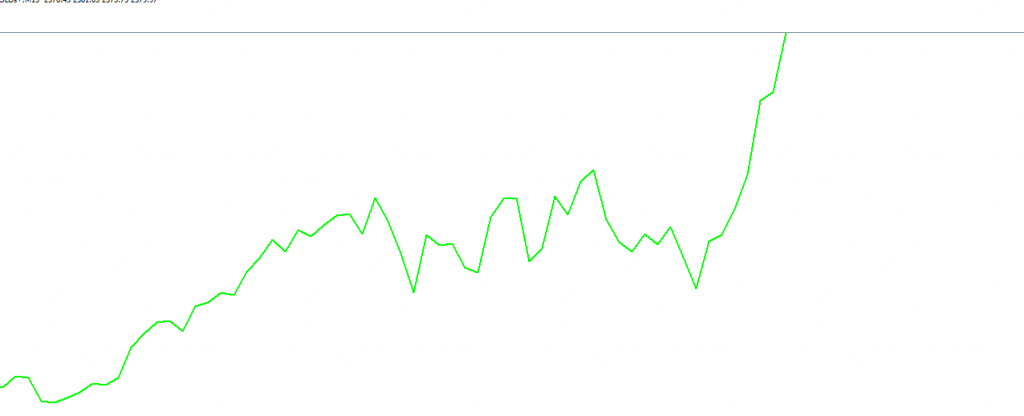
Line Chart: Displays the closing price over time.
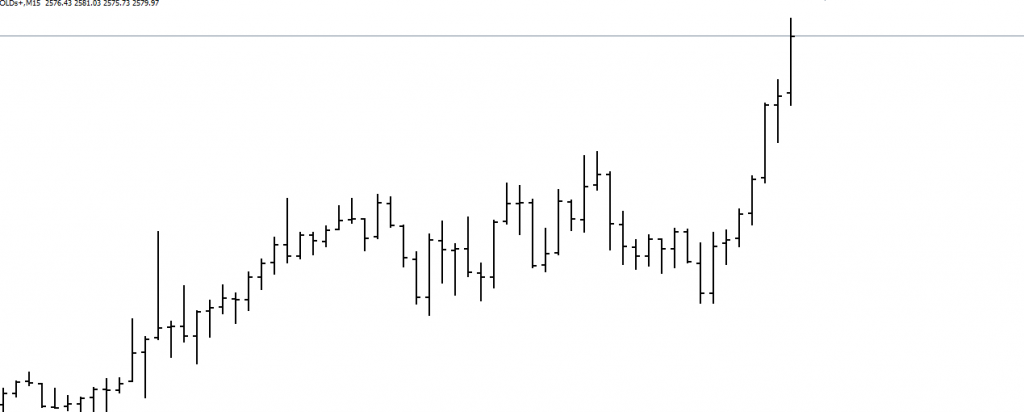
Bar Chart: Shows open, high, low, and close prices for a given period.
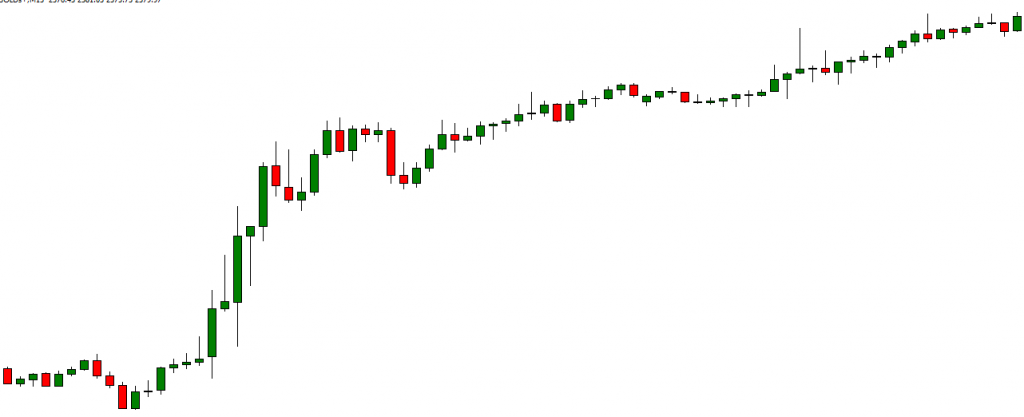
Candlestick Chart: Offers detailed insights into price action, showing bullish and bearish trends.
2. Technical Indicators
Technical indicators help traders analyze price trends, momentum, and potential reversals. Popular indicators include:
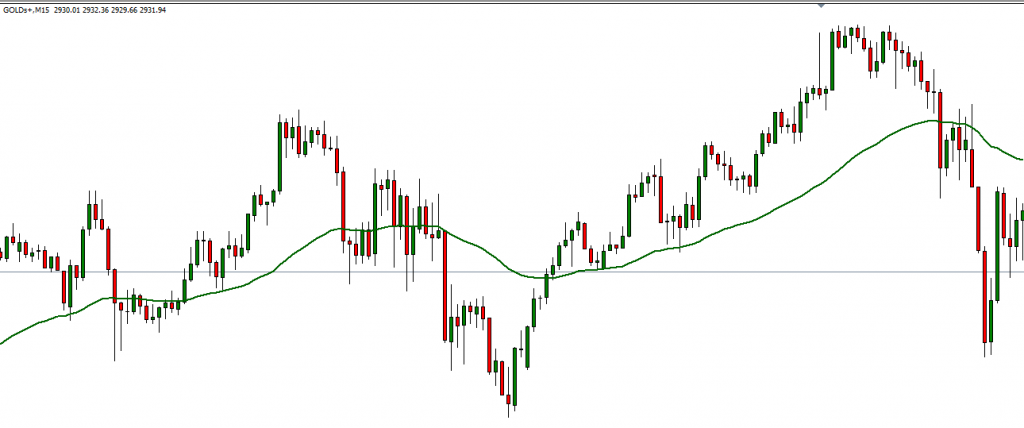
Moving Averages (MA): Smooth out price fluctuations to identify trends.
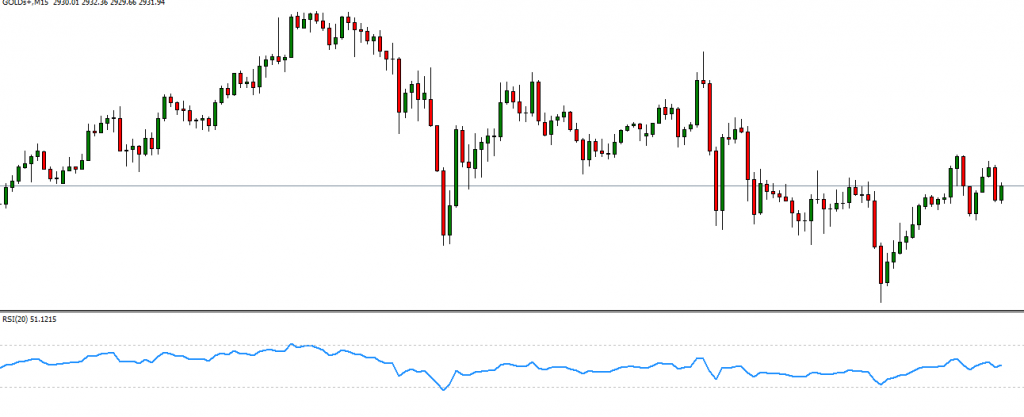
Relative Strength Index (RSI): Measures market momentum and indicates overbought or oversold conditions.
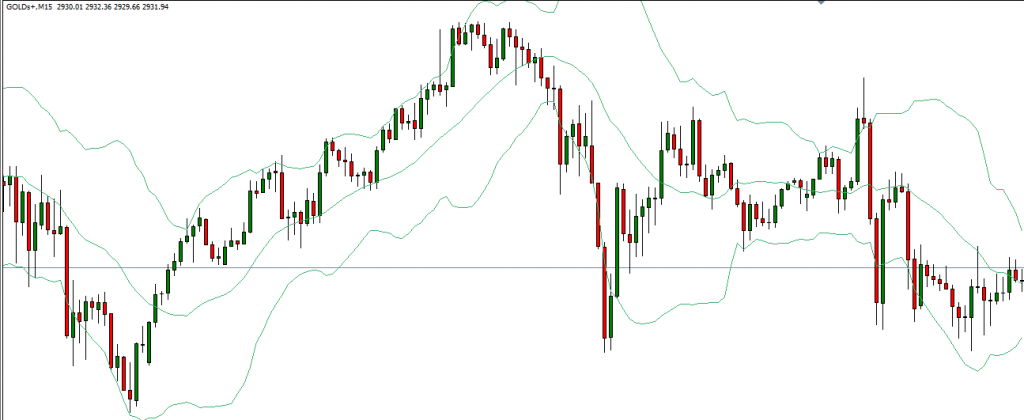
Bollinger Bands: Assess price volatility by plotting bands around a moving average.
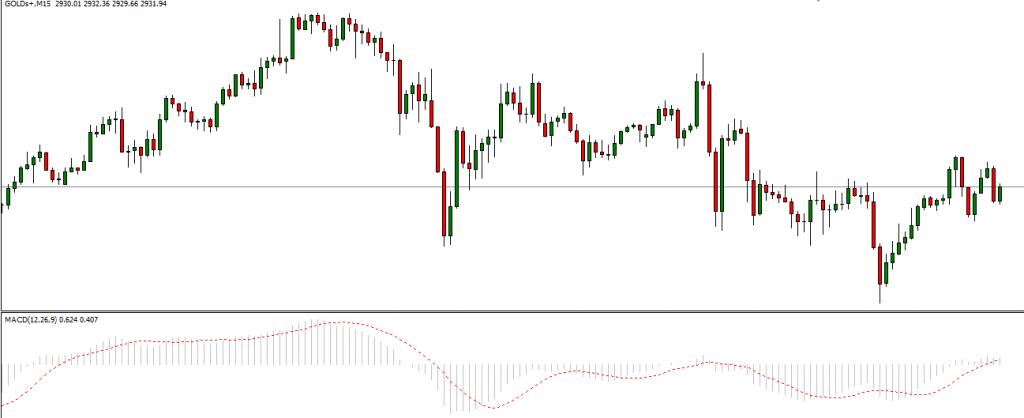
MACD (Moving Average Convergence Divergence): Helps traders identify trend direction and momentum shifts.
3. Support and Resistance Levels
Support and resistance levels are key price points where buying or selling pressure is strong. Traders use these levels to determine entry and exit points:
Support Level: A price level where demand is strong, preventing further declines.
Resistance Level: A price level where selling pressure is high, preventing further increases.
4. Chart Patterns
Chart patterns help traders recognize potential market movements based on past trends. Common patterns include:
Head and Shoulders: Signals a potential trend reversal.
Double Top and Double Bottom: Indicates possible market turning points.
Triangles (Ascending, Descending, Symmetrical): Suggest breakout or continuation patterns.
How Traders Use Technical Analysis
Short-Term Trading
Day traders and swing traders heavily rely on technical analysis to make quick decisions based on price trends and patterns.
Trend Following
Traders use indicators like moving averages and MACD to identify and follow market trends, buying in uptrends and selling in downtrends.
Risk Management
Technical analysis helps traders set stop-loss orders and take-profit levels, managing risk and maximizing potential gains.
Conclusion
Technical analysis is a powerful tool for traders seeking to understand market trends and price movements. By studying price charts, indicators, and historical patterns, traders can make informed decisions and improve their chances of success in financial markets. While no strategy guarantees success, combining technical analysis with proper risk management can enhance trading performance.