It is of a fact that forex trading relies heavily on reliable forex indicators to help traders make informed decisions. Some indicators have continued to prove their reliability due to their strong analytical capabilities and widespread use among traders.
This article explores the most reliable forex indicators traders should consider using in 2025 and how to use them effectively.
Understanding Forex Indicators
Forex indicators are tools traders use to analyze currency price movements and trends. They help traders make better decisions by providing signals based on historical price data, volume, and volatility. These indicators fall into different categories:
- Trend Indicators: Help identify the direction of the market trend.
- Momentum Indicators: Show the strength of a trend and possible reversals.
- Volatility Indicators: Measure market fluctuations.
- Volume Indicators: Show the number of trades in a particular time frame.
By using a combination of these indicators, traders can improve their strategies and increase their chances of making profitable trades.
Below are 5 most reliable indicators FX traders can use;
1. Relative Strength Index (RSI)
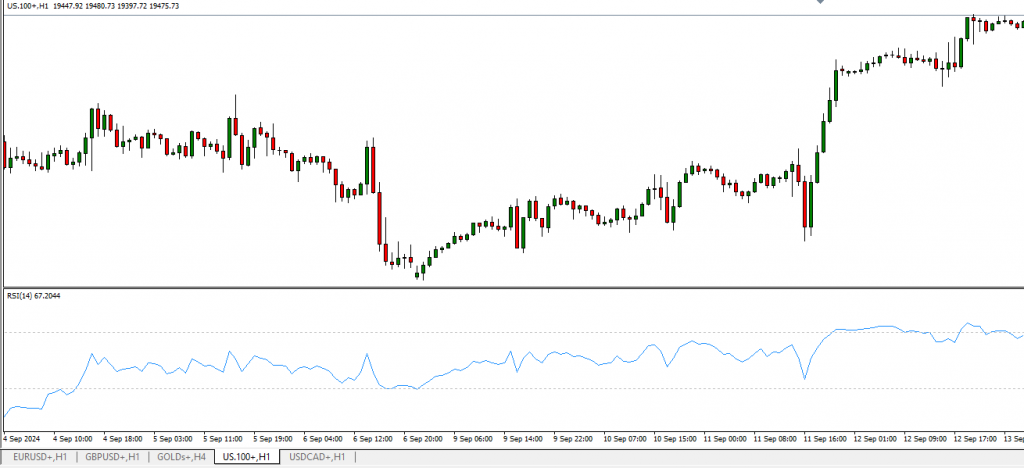
The RSI is a momentum oscillator that measures the speed and change of price movements. It ranges from 0 to 100 and is typically used to identify overbought or oversold conditions:
- RSI above 70 suggests an overbought market (potential for a price drop).
- RSI below 30 indicates an oversold market (potential for a price rise).
How to Use RSI
Traders use RSI to detect trend reversals. If RSI moves from overbought territory downward, it may signal a sell opportunity, whereas an upward move from oversold territory could signal a buy.
Divergences between RSI and price movement can also indicate trend reversals. If prices make new highs but RSI fails to do so, it suggests a weakening trend. Additionally, RSI can be used to confirm trends—strong trends tend to remain in the overbought or oversold regions for extended periods.
2. Bollinger Bands
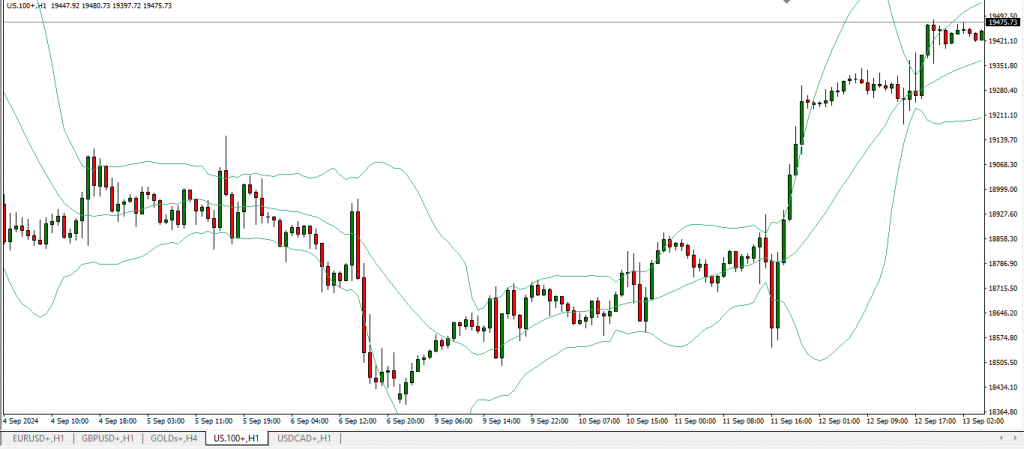
Developed by John Bollinger, this indicator consists of three lines:
- A middle band (SMA)
- An upper band (SMA + standard deviation)
- A lower band (SMA – standard deviation)
Bollinger Bands helps traders identify volatility and potential breakout opportunities. When the bands contract, it signals low volatility, and when they expand, it suggests increased volatility.
How to Use Bollinger Bands
Traders use Bollinger Bands to anticipate breakouts. When prices touch the upper band, they may be overbought; when they touch the lower band, they may be oversold.
A “Bollinger Squeeze” occurs when the bands tighten around the price, indicating a potential breakout in either direction. Traders often look for confirmation from other indicators before entering trades based on Bollinger Band signals.
Additionally, prices that frequently touch the upper or lower bands without breaking through may indicate strong support or resistance levels. Combining Bollinger Bands with candlestick patterns can further enhance accuracy.
3. Moving Average Convergence Divergence (MACD)
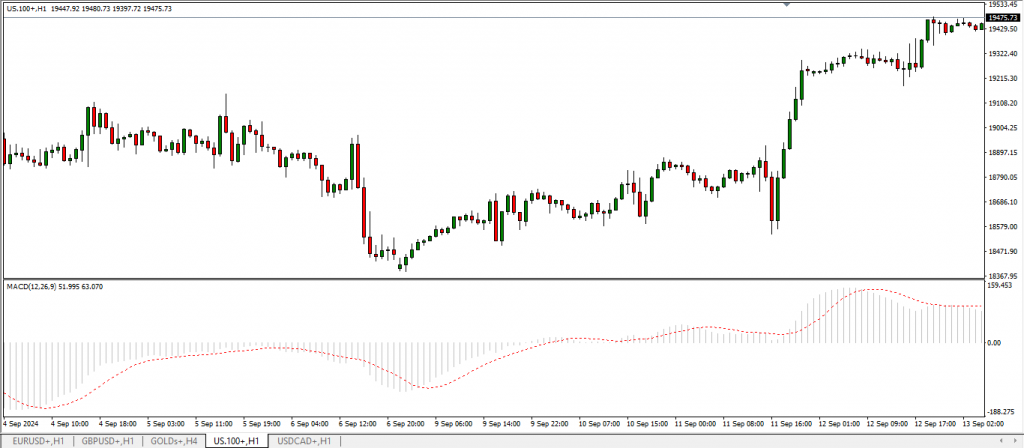
MACD is a trend-following indicator that helps traders identify potential buy and sell signals. It consists of:
- The MACD line (difference between the 12-day and 26-day EMAs)
- The Signal line (9-day EMA of the MACD line)
- A histogram that shows the difference between the two lines
How to Use MACD
- A bullish signal occurs when the MACD line crosses above the signal line.
- A bearish signal occurs when the MACD line crosses below the signal line.
Divergences between MACD and price movement can also indicate reversals. If the price makes new highs but MACD fails to follow, it may signal a weakening trend.
One advanced MACD strategy is the “Zero Line Crossover.” When the MACD line crosses above zero, it indicates upward momentum, while crossing below zero suggests downward momentum. Combining MACD with RSI or Bollinger Bands can provide additional confirmation for trade decisions.
4. Stochastic Oscillator
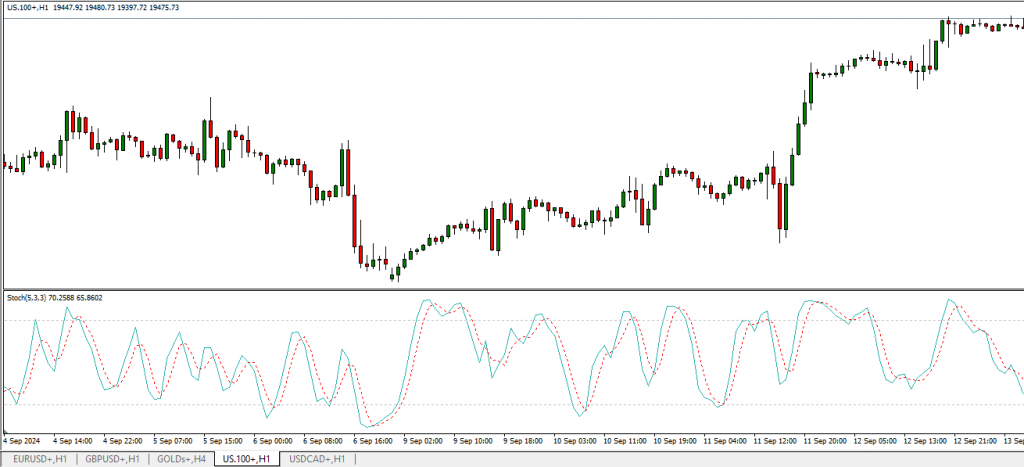
The Stochastic Oscillator is a momentum indicator that compares a security’s closing price to its price range over a specific period. It ranges from 0 to 100 and is useful in identifying overbought and oversold conditions.
How to Use a Stochastic Oscillator
- Readings above 80 indicate overbought conditions (potential sell signal).
- Readings below 20 indicate oversold conditions (potential buy signal).
- A bullish signal occurs when the %K line crosses above the %D line in the oversold region, while a bearish signal occurs when it crosses below the overbought region.
5. Ichimoku Kinko Hyo
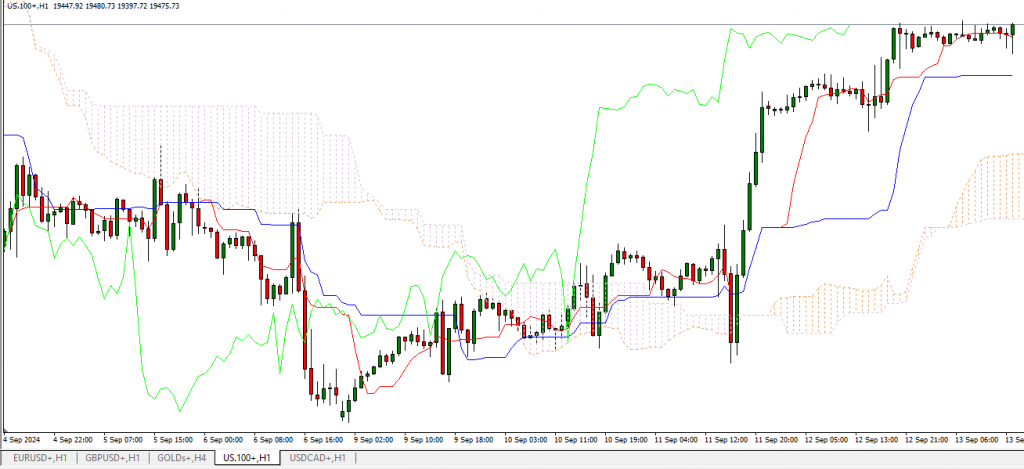
The Ichimoku Kinko Hyo is a comprehensive indicator that provides information about support, resistance, momentum, and trend direction. It consists of five lines:
- Tenkan-sen (Conversion Line)
- Kijun-sen (Base Line)
- Senkou Span A (Leading Span A)
- Senkou Span B (Leading Span B)
- Chikou Span (Lagging Span)
How to Use Ichimoku Kinko Hyo
- When the price is above the cloud, it indicates an uptrend.
- When the price is below the cloud, it signals a downtrend.
- When the cloud turns from red to green, it suggests bullish momentum, while a switch from green to red indicates bearish momentum.
Conclusion
The best forex traders use a combination of these indicators to enhance their trading strategies. While no single indicator guarantees success, understanding how to interpret these tools can significantly improve trading accuracy. Traders should combine trend, momentum, and volatility indicators to create well-rounded strategies.
In 2025, with increased market volatility and evolving trading technologies, traders must stay informed about market conditions and continuously refine their skills. By mastering these reliable forex indicators, traders can navigate the forex market more effectively and improve their profitability.


