
Trading in financial markets involves analyzing assets to determine their potential future value. While technical analysis focuses on price movements and patterns, fundamental analysis examines economic, financial, and qualitative factors to identify an asset’s true worth. This guide explores the core aspects of fundamental analysis and how traders can use it effectively.

What is Fundamental Analysis?
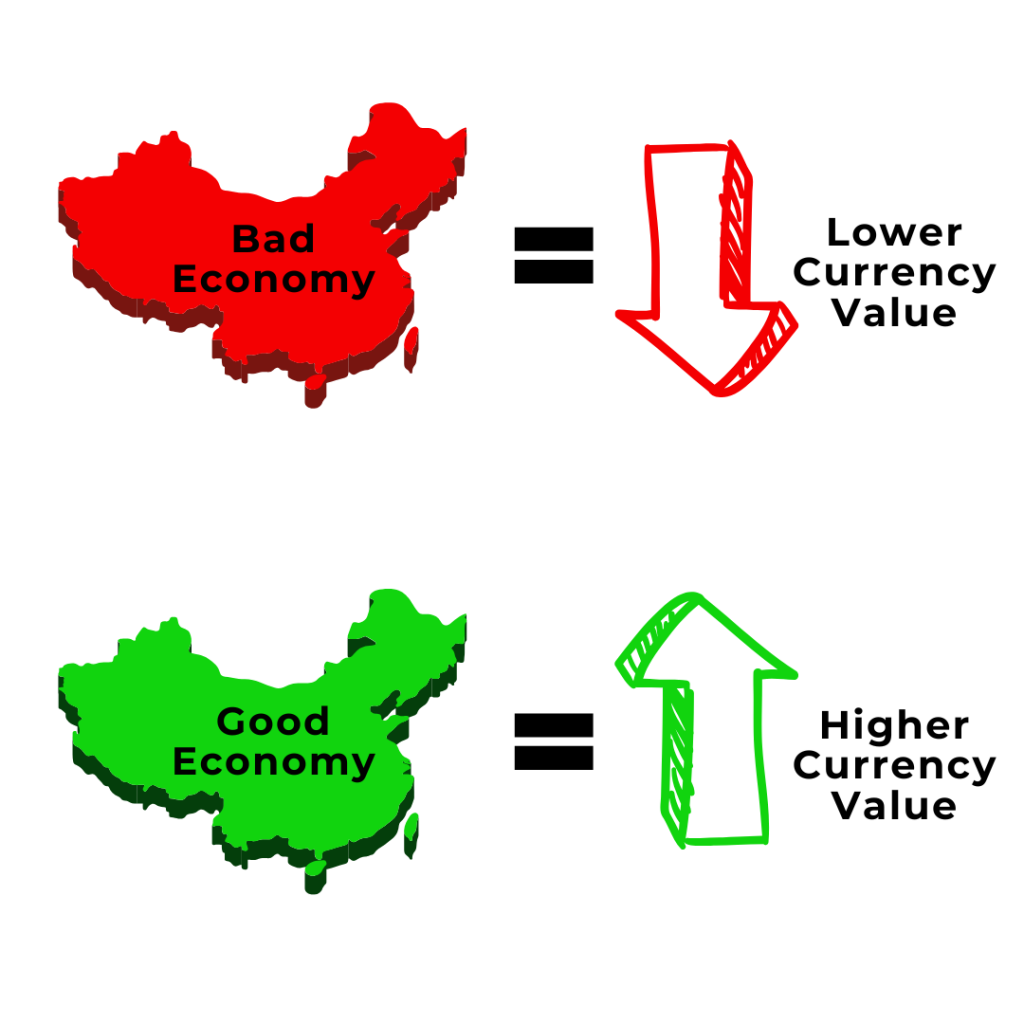
Fundamental analysis is a way of looking at the forex market by monitoring economic, social, and political forces that may affect currency prices.
It is the study of macroeconomic and microeconomic factors that influence an asset’s price. It seeks to evaluate an asset’s essential value by examining relevant financial and economic data. Investors and traders use this approach to identify whether an asset is overvalued or undervalued, helping them make informed trading decisions.
Unlike technical analysis, which relies on historical price data and chart patterns, fundamental analysis uses a broader economic picture to forecast currency price movements.
Key Elements of Fundamental Analysis
1. Economic Indicators
Macroeconomic indicators provide insights into the overall health of an economy, which can influence financial markets. Key indicators include:
Gross Domestic Product (GDP): Measures economic growth and productivity.
Interest Rates: Central banks set interest rates, impacting borrowing, spending, and investment.
Inflation: Rising inflation can erode purchasing power, affecting asset prices.
Employment Data: High employment rates signal economic strength, while high unemployment can indicate weakness.
2. Financial Statements (For Stocks)
For stock traders, analyzing a company’s financial health is essential. Key financial statements include:
Income Statement: Shows a company’s profitability over a period.
Balance Sheet: Displays assets, liabilities, and shareholder equity.
Cash Flow Statement: Tracks cash inflows and outflows to assess financial stability.
3. Company Valuation Metrics
Valuation ratios help traders compare a company’s stock price to its financial performance. Common metrics include:
Price-to-Earnings (P/E) Ratio: Compares stock price to earnings per share.
Price-to-Book (P/B) Ratio: Evaluates stock price relative to book value.
Dividend Yield: Measures return on investment from dividends.
4. Industry and Market Conditions
Analyzing industry trends and competitive positioning helps traders assess whether a company is well-positioned for growth. Factors such as technological advancements, regulatory changes, and market demand play a crucial role.
5. Geopolitical and News Events
Global events, political developments, and news reports can significantly impact market sentiment. For example, trade agreements, conflicts, and corporate earnings announcements can cause market fluctuations.
6. Central bank announcements
Central banks play a major role in driving volatility across various asset classes. Their key action, adjusting interest rates can significantly influence currencies, stocks, indices, and other financial markets.

7. Natural disaster and Seasonality
Although these factors may appear unrelated to the markets, they often contribute to volatility across multiple assets.
Natural disasters can create challenges for businesses and economies, disrupting supply chains for various commodities. Similarly, seasonal weather conditions can have the same impact.
Political changes within a country can have a significant impact on financial markets. A new leader, for example, might introduce policies that challenge businesses or prioritize infrastructure investment.
Geopolitical events also play a crucial role. For instance, escalating conflict in the Middle East can disrupt the global oil supply, causing prices to rise. Consequently, businesses that depend heavily on oil may experience reduced profits.
How Traders Use Fundamental Analysis
Long-Term Investing
Fundamental analysis is often used by investors who adopt a long-term approach. By analyzing financial and economic data, they aim to identify strong companies or assets with growth potential.
Swing Trading
Swing traders may use fundamental analysis in combination with technical analysis to identify short- to medium-term trading opportunities. For example, positive earnings reports or strong economic indicators can signal potential upward movement in asset prices.
Forex Trading
Forex traders focus on fundamental factors like central bank policies, interest rates, and economic reports to determine currency strength. For example, a country with rising interest rates may see increased demand for its currency.
Conclusion
Fundamental analysis provides a strong foundation for making informed trading decisions by assessing economic, financial, and geopolitical factors. While it requires thorough research, it helps traders understand market trends and asset valuations beyond price movements. By combining fundamental analysis with technical strategies, traders can develop a well-rounded approach to navigating financial markets successfully.
Hi there friends, how is the whole thing, and what you wish for to say
regarding this article, in my view its genuinely amazing for me.